Most "best product analytics tools" lists rank the same names - Amplitude, Mixpanel, Heap, PostHog - and stop there. They tell you which tools exist. They rarely tell you how to choose between them, and they skip the two things that actually determine both your invoice and whether the tool changes any decision: the pricing model and whether the analytics connects to anything else.
This is a decision framework, not a roundup. Five criteria, an honest counter-case, and the one question the listicles never ask. For the full ranked comparison of individual tools, see our best product analytics tools guide.
How do you choose a product analytics tool?
Choose a product analytics tool by scoring candidates on five criteria in order: the pricing model, time to first insight, what you can capture and own, single-job depth, and whether the data connects to feedback and revenue. Two tools with identical feature lists can bill three times apart and deliver different outcomes - because one answers "what happened" and the other ties it to "did it matter."
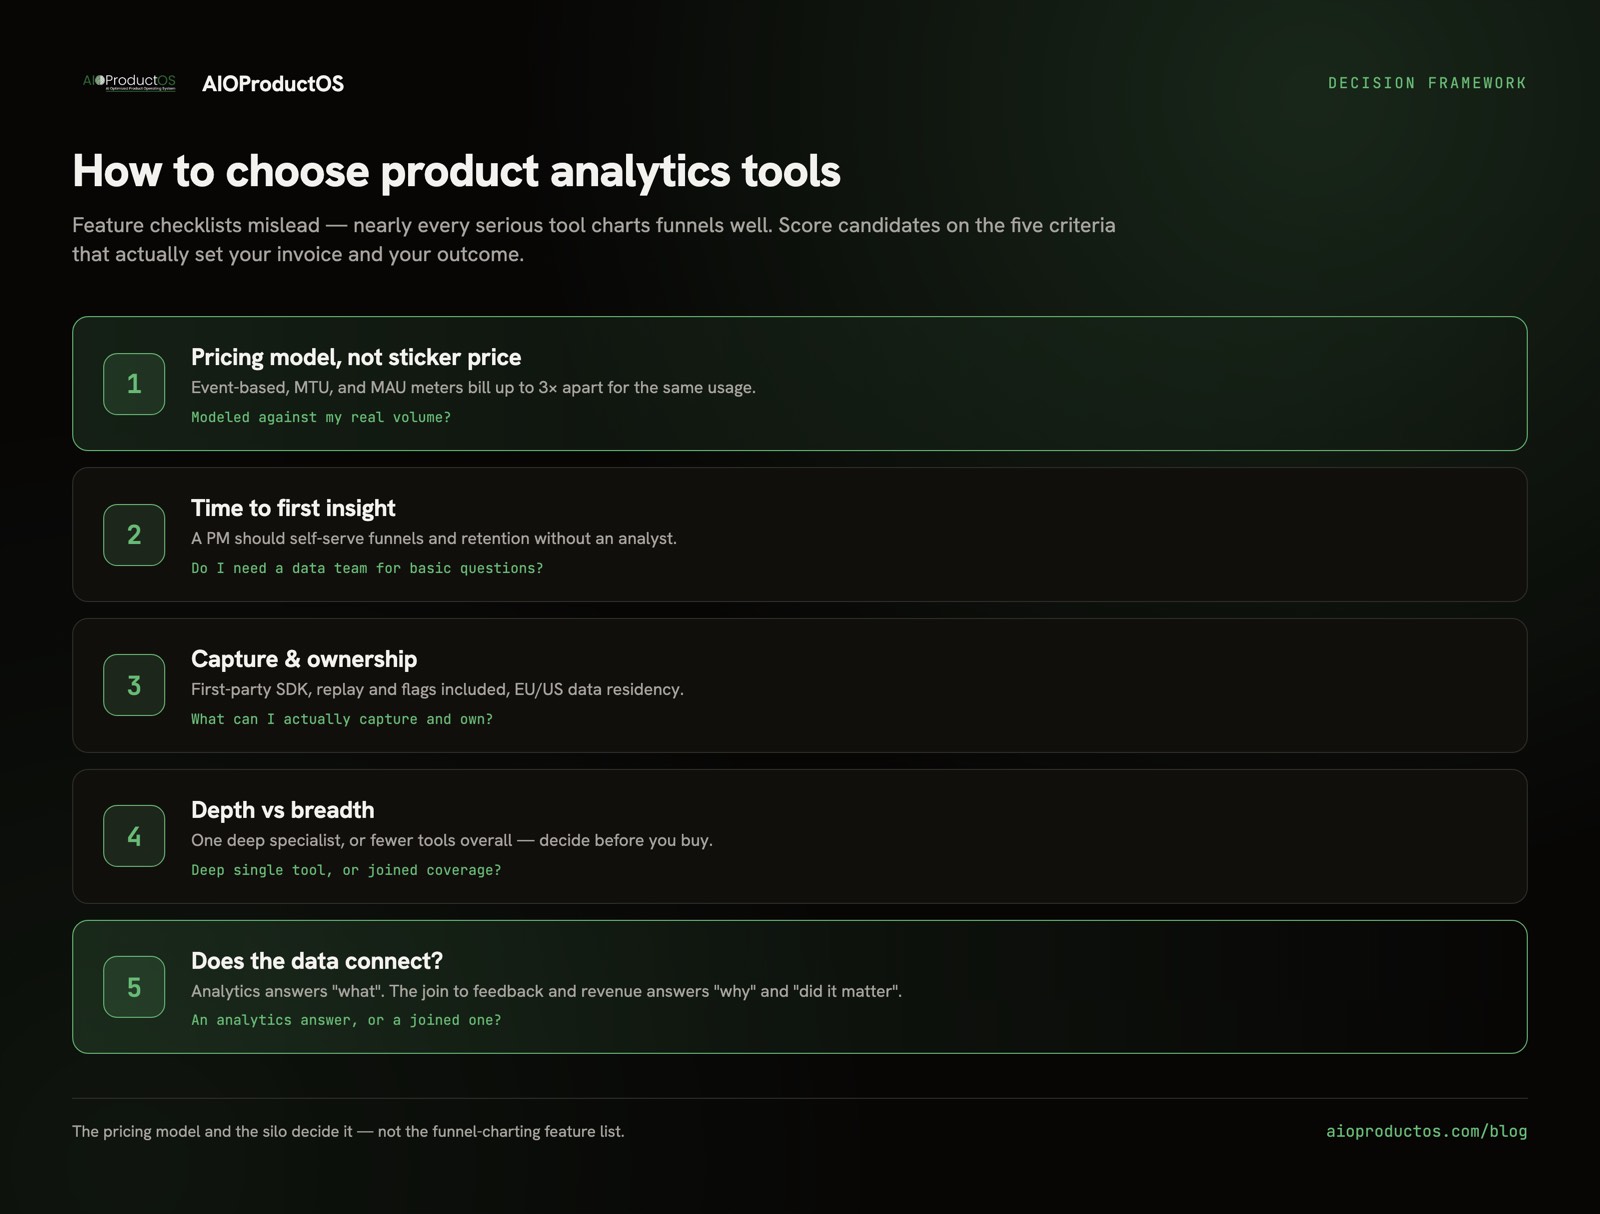
The reason feature checklists mislead is that nearly every serious tool now charts funnels, retention, and paths competently. The differences that hit your budget and your roadmap live somewhere the comparison tables don't look.
The five criteria that actually decide it
1. The pricing model, not the sticker price
This is the criterion the roundups bury, and it moves the invoice more than any feature. Product analytics tools meter on fundamentally different units: some are event-based (you pay per tracked event), some are MTU-based (per monthly tracked user), and some are MAU-based (per monthly active user). For the same product usage, those three models produce wildly different bills.
Event-based pricing punishes instrumentation - the more you track, the more you pay, so teams under-instrument to control cost and then can't answer the question they instrumented for. MTU and MAU models are more predictable but can spike with a traffic burst or a marketing campaign. Before you compare features, model your own volume against each meter. We break the mechanics down in product analytics pricing in 2026; the short version is that the pricing model is a bigger decision than the tool.
2. Time to first insight - do you need a data team?
Ask how long it takes a product manager, not an analyst, to get a real answer. The best product analytics tools are self-serve: a PM builds a funnel, checks retention, and reads a drop-off without writing SQL or filing a ticket. If a tool needs a dedicated analyst to answer "where do new users drop off," that dependency will quietly throttle how often anyone actually looks.
You do not need a data team to run product analytics for shipping decisions. You need one for warehouse-level modeling and bespoke analysis - a different job. If you're wary of instrumentation overhead, product event tracking without a data team covers how far a small team can get alone.
3. What you can actually capture and own
Look at the SDK and the data posture, not just the dashboard. First-party capture - events collected on your own domain - is more durable against browser and privacy restrictions than third-party scripts. Check whether you can capture web and product events from one lightweight SDK, whether session replay and feature flags come from the same capture layer, and where the data physically lives. EU or US data residency matters for a lot of teams and is often gated to expensive tiers. Our lightweight product analytics SDK write-up covers what a capture layer should do without bloating your bundle.
4. Depth versus breadth
Be honest about whether you want one deep tool or fewer tools overall. A dedicated analytics platform will out-depth a broader product platform on pure analysis - custom cohort math, advanced segmentation, experimentation rigor. A broader platform trades some of that depth for coverage across jobs. Neither is universally right. What's wrong is buying deep specialist analytics you'll never fully use, or buying breadth when one analysis lane is 80% of your work.
5. Whether the data connects to anything
Here is the criterion the page-one listicles skip entirely. A standalone analytics tool tells you what happened. It does not know why - the feedback behind the drop-off - or whether it mattered - the revenue attached to the users who churned. When analytics lives in its own silo, someone spends their week exporting charts and pasting them next to feedback and revenue by hand.
That fragmentation is a measured cost, not a vibe. The average company now runs 101 SaaS apps and wastes about $21M a year on licenses nobody uses, and 68% of tech leaders are consolidating vendors in 2026 for exactly this reason. Before adding another disconnected analytics subscription, ask whether the answer you need is an analytics answer or a joined one.
Here's the framework as a scorecard:
| Criterion | The question to ask | Why it decides the outcome |
|---|---|---|
| Pricing model | Event-based, MTU, or MAU - modeled against my real volume? | Same usage can bill 3× apart; the meter, not the sticker price, sets your cost |
| Time to insight | Can a PM answer a funnel question without an analyst? | A tool nobody self-serves gets checked rarely and changes few decisions |
| Capture + ownership | First-party SDK, replay/flags included, EU/US residency? | Determines data durability and what questions you can ever ask |
| Depth vs breadth | Do I want one deep tool or fewer tools total? | Prevents paying for depth you won't use - or breadth that skips your one hard job |
| Connection | Does this join to feedback, revenue, and work - or silo? | Analytics answers "what"; the join answers "why" and "did it matter" |
What is the difference between Amplitude, Mixpanel, and PostHog?
All three are event-based product analytics tools, and all three chart funnels, retention, and paths well. The real differences map to the criteria above. Amplitude and Mixpanel are mature analytics suites that meter on tracked events or monthly users - strong depth, and the pricing model is the thing to model carefully. PostHog bundles analytics, session replay, and feature flags in one platform rooted in open source, with a usage-based free tier that makes it a common zero-cost starting point alongside GA4.
So the choice between them is rarely "which draws a better funnel." It's which billing meter fits your volume, and how much of the surrounding stack - replay, flags, capture - you want from one vendor versus several.
When a standalone analytics tool is the right call
A connected platform isn't always the answer, including ours. Cases where a dedicated point tool genuinely wins:
- Analysis depth is the whole job. If you have a data team doing warehouse-level cohort and behavioral modeling, a specialist like Amplitude's analysis depth beats a broader platform's built-in analytics. That's a real lane, and we say so.
- You want free and self-hosted. PostHog's free tier and open-source roots are hard to argue with for an early team that wants to own the stack and pay nothing to start.
- You're only measuring the marketing site. For pageview and acquisition analytics with no product-usage join, GA4 or a lightweight tool covers it at zero cost.
- Your stack already works. If analytics, feedback, and revenue are already integrated and nobody's copy-pasting between them, switching costs are real and the status quo deserves respect.
AIOProductOS is not a like-for-like swap for a single analytics tool - the value is the join, and where you don't need the join, a point tool is the honest pick.
How to decide
Skip the tool-ranking listicles until you've scored the five criteria. Model the pricing meter against your real volume, confirm a PM can self-serve, check what you can capture and own, decide deep-versus-broad, and - the one most guides miss - ask whether you need an analytics answer or a joined one.
If the join matters, AIOProductOS puts first-party web and product analytics, revenue-weighted funnels and retention, replay, and flags on the same record as feedback and revenue - so every shipped feature carries a verdict for adoption, MRR adopted, and retention lift. See how connected analytics works.