Every SaaS spend audit starts the same way. Someone exports the billing statements, tallies the monthly line items, and reports a number. That number is real. It is also the smallest part of what your stack costs - and for a product team, the least interesting part. The expensive part never lands on an invoice.
What does SaaS tool sprawl actually cost a product team?
For a small product team, the largest cost of SaaS tool sprawl is not the subscriptions - it's the integration tax. That's the engineering time spent wiring disconnected tools together, plus the customer context lost in the gaps between your tracker, roadmap, analytics, feedback inbox, and delivery tools. Licenses are visible on a spreadsheet. The seams between tools are not.
The "hidden costs of SaaS sprawl" guides that rank for this topic are written for IT and finance leaders at large organizations. Their frame is license waste and shadow IT: apps bought without approval, seats paid for and never used, renewals that auto-charge in the dark. That frame is correct, and the numbers behind it are large. The average company runs 101 SaaS apps and wastes around $21M a year on licenses nobody uses (Okta, Zylo).
But a ten-person product team does not have 101 apps or a $21M problem. It has six or seven tools that each do their job well and none of which know the others exist. The cost here isn't waste. It's disconnection - and disconnection is more expensive than a few idle seats, because it's paid by the people building the product, not the people paying the bills.
The rest of this post prices that disconnection. If you'd rather skip to the structural answer first, it's one shared customer record that revenue, feedback, work, and code all write to.
Where the money actually goes
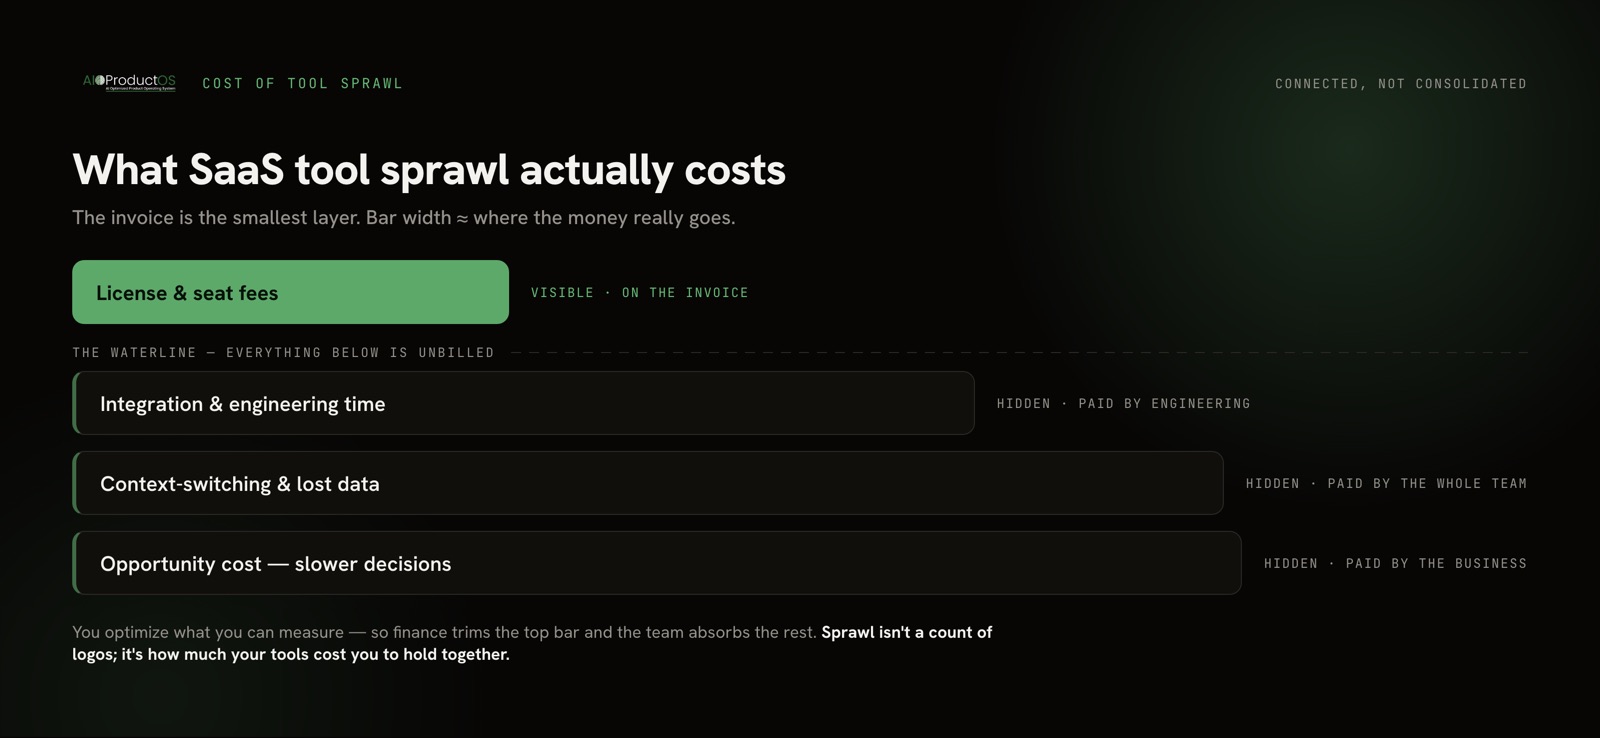
Sort the cost of a product stack into layers and the pattern is clear: the layer finance can see is the cheap one. The layers that hurt are the ones no dashboard tracks.
| Cost layer | Visible on the invoice? | Who actually pays it |
|---|---|---|
| License and seat fees | Yes | Finance |
| Integration and engineering time | No | Engineering |
| Context-switching and lost data | No | The whole team |
| Opportunity cost (slower decisions) | No | The business |
Finance optimizes the top row because it's the only row they can measure. Everyone downstream absorbs the rest silently. That's why sprawl feels cheap on the books and expensive in the work.
The integration tax nobody puts on a spreadsheet
Here is the cost the governance guides miss. When your feedback tool, your tracker, your roadmap, and your analytics are separate products, someone has to keep them in sync by hand - or a developer has to build and maintain the plumbing that does it.
A feature request lands in the feedback inbox. Someone copies it into the tracker. When it ships, someone updates the roadmap tool so it doesn't lie. To answer "did that feature work?", someone exports analytics and manually joins it back to the customer who asked. Every one of those steps is a seam. Every seam is either a recurring manual habit that eats an hour a week, or a brittle integration a developer babysits instead of building product.
That maintenance is real and measurable in aggregate. Best-of-breed stacks require 280% more maintenance than an all-in-one, which is a large part of why 68% of tech leaders are consolidating vendors in 2026. They're not chasing a cheaper bill. They're trying to stop paying the integration tax.
The team-level version of that tax is context loss. Context-switching costs an estimated $450B a year, and the average employee loses 40% of productive time to it (Gallup / TheTab). A product team living across seven tabs pays that tax on every decision - jumping from tracker to analytics to feedback to piece together what a single tool would show on one screen. We've written more on how that specifically hits product teams in the real cost of context-switching.
None of this appears when you tally subscriptions. It's the difference between what your stack costs and what your stack charges. A quick way to see the gap for your own team is to model it directly with the SaaS stack cost calculator - it counts the seams, not just the seats.
When more tools is still the right call
Consolidation is not automatically the answer, and anyone selling you that it is should be treated with suspicion. More tools is the right call in three honest cases.
Best-of-breed depth you genuinely rely on. If your designers live in Figma, keep Figma. If your data team runs a warehouse and a BI stack, a product tool will not replace it and shouldn't try. Depth in a tool your team uses every day is worth the seam.
Genuinely different jobs. A tool that serves a job nothing else in your stack touches is not sprawl. Two overlapping tools that half-cover the same job is sprawl. One tool with a clear, non-duplicated purpose is just software.
Consolidation for its own sake is its own trap. Swapping six good tools for one mediocre one is a downgrade, not a saving. Cutting your logo count while losing capability the team depended on will cost you more than the licenses ever did. The point is never fewer tools. The point is fewer disconnected ones.
If the tools you're paying for each earn their place and the seams between them are cheap, your stack isn't a sprawl problem - it's a stack. Leave it alone.
Connected, not consolidated
The distinction that matters is this: you probably don't have too many tools. You have a stack that doesn't talk to itself. The fix isn't to rip everything out and replace it with one product that does every job worse. The fix is to put the tools on one shared record so the data stops living in silos.
That's the approach AIOProductOS takes. Instead of a tracker over here and analytics over there, every source joins onto one customer record - revenue, feedback, work, and code on the same spine. A tracker shows the what: the task list. The spine shows the why: every task carries the customer, the feedback, and the revenue behind it, because it's the same record, not a nightly sync between two products. Pricing is flat by tier with the whole team included - no per-seat metering, so adding a person to the record doesn't reprice the tool.
You don't have to abandon what works to get there. Over 100 live connectors feed the tools you keep into that one spine, so the seams collapse without a rip-and-replace project. Depth where you want it; one record underneath it. We break the full stack-versus-spine math down in the real cost of a product tool stack.
Sprawl isn't a count of logos. It's a measure of how much your tools cost you to hold together. Count that number before you count your subscriptions - it's the one that's actually growing.
Put a real figure on your own stack. The SaaS stack cost calculator adds up the license fees, the integration time, and the context lost between your tools - the whole bill, not just the part on the invoice. It runs in your browser, no signup.