Search "amplitude vs mixpanel vs posthog" and you get two kinds of page: vendor compare pages that conveniently conclude the vendor wins, and independent feature checklists that stop at "all three do funnels." Neither helps you decide, because the interesting differences moved. Amplitude and Mixpanel have converged, PostHog changed the shape of the question, and the thing that actually determines your invoice, the pricing model, rarely makes the table.
This is a neutral comparison of where the three genuinely differ in 2026, an honest note on when a dedicated tool is the right call, and the one question none of these pages ask.
Amplitude vs Mixpanel vs PostHog: which should you choose?
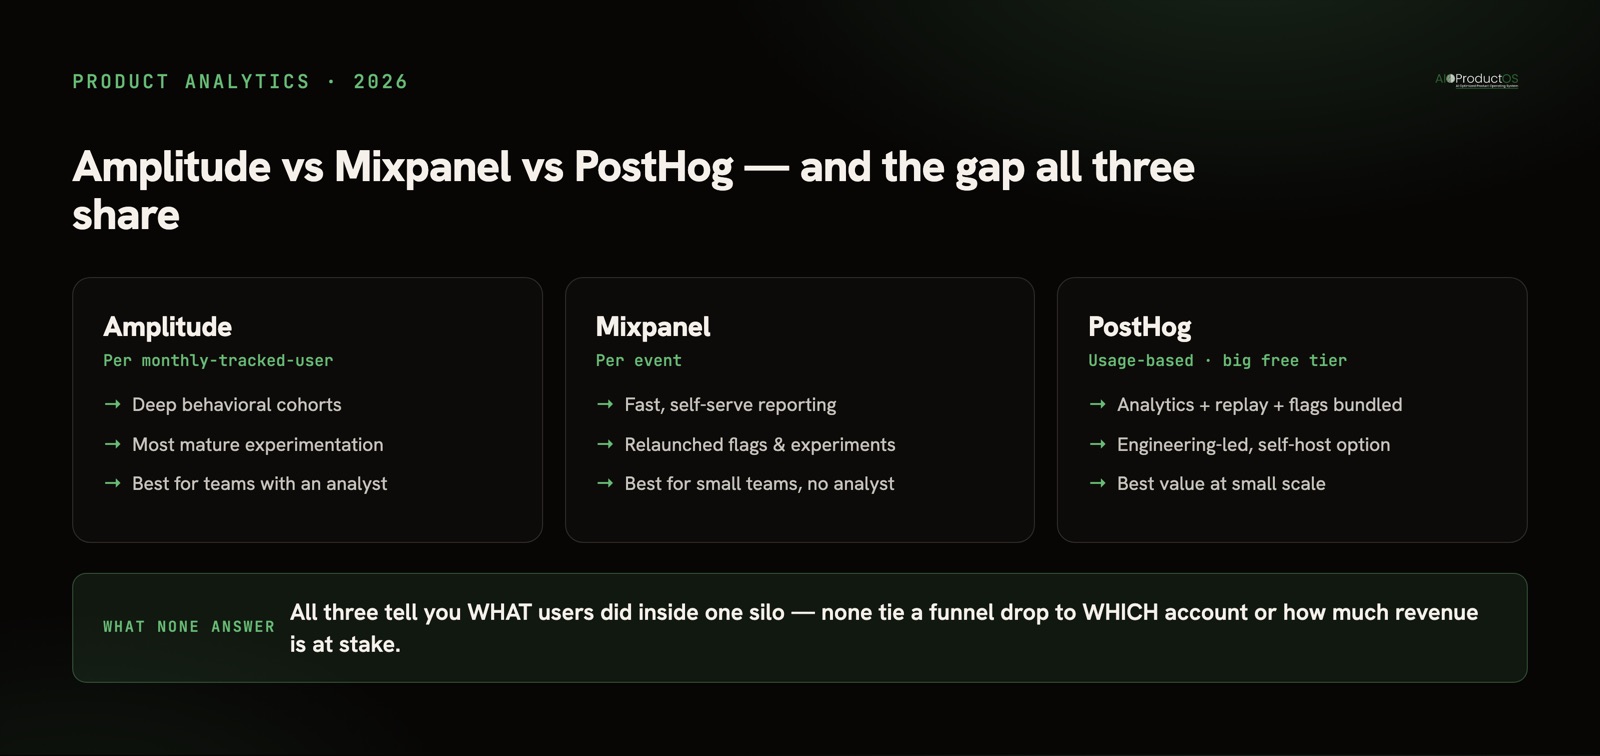
Choose Amplitude for deep behavioral analysis and mature experimentation; choose Mixpanel for fast, event-based reporting a small team can self-serve without an analyst; choose PostHog if you want analytics, session replay, and feature flags bundled with the most usable free tier. All three answer what users did - none tie that behavior to who the customer is or the revenue at stake.
That is the short version. The rest of this post is why, and where each one is honestly the wrong pick. If it's that last gap you came for - the behavior, but joined to the account paying for it - that's revenue-weighted funnels on the customer record, and it's a different product category than the three below.
How the three compare
| Amplitude | Mixpanel | PostHog | |
|---|---|---|---|
| Pricing model | Per monthly-tracked-user (MTU) | Per event | Usage-based, generous free tier |
| Best for | Teams that need deep behavioral analysis and mature experimentation | Small teams that want fast, self-serve event reporting | Engineering-led teams wanting analytics + replay + flags in one place |
| Strengths | Advanced cohorts, predictive segmentation, the most mature experimentation | Quick to set up, readable reports, event-first mental model | Bundled analytics, replay, flags and experiments; open-source roots; self-host option |
| Main weakness | MTU billing and depth can be more than a small team needs | Relaunched flags/experiments are newer and less proven than Amplitude's | Less deep on advanced behavioral cohorts and predictive segmentation |
| Free tier | Limited free plan | Free plan with an event allowance | The most generous of the three |
Read the pricing row first. Each vendor's public pricing meters on a different unit, and for the same product usage those units produce very different bills - event-based pricing punishes heavy instrumentation, MTU pricing tracks your user count, and usage-based-with-a-free-tier is cheapest to start. Model your own volume against each meter before you compare a single feature. We walk through the mechanics in product analytics pricing in 2026.
The convergence nobody flags
The old comparison assumed three distinct tools. In 2026 that is less true. Amplitude and Mixpanel have converged: both now offer session replay, and Mixpanel relaunched experimentation and feature flags in late 2025. The gap between them has narrowed to two things - Amplitude's experimentation and advanced behavioral analysis are more mature, and the billing unit differs (MTU versus per-event).
PostHog approached the category from the other side. Rather than deepening one capability, it bundled analytics, session replay, feature flags, and experiments into a single platform, added a genuinely usable free tier, and leaned into an engineering-led, open-source-rooted model. It is the broadest of the three for the money and the easiest to start for free. It is also the least deep on the advanced cohort and predictive-segmentation work Amplitude is built around.
So the honest 2026 framing is not "which of three different tools." It is: do you want maximum depth (Amplitude), a fast event-based suite that is quick to self-serve (Mixpanel), or the widest bundle with the best free tier (PostHog)? That question you can actually answer against your own team.
Which team should pick which
A small team, pre-data-hire, that wants answers this week without an analyst tends to land on Mixpanel or PostHog - Mixpanel for a clean event-reporting workflow, PostHog if replay and flags matter and budget is tight. Our how to choose product analytics tools framework scores exactly this trade-off.
A team whose bottleneck is analytical depth, meaning complex cohorts, predictive segmentation, and a real experimentation program, is the case Amplitude was built for, and the one where paying for depth pays back.
An engineering-led team that would otherwise buy analytics, a replay tool, and a flags tool separately usually finds PostHog consolidates that set at a lower starting cost, with self-hosting available when data control matters.
When a dedicated analytics tool is the right call
Here is the concession, plainly: if product analytics is your deepest need, buy the best dedicated tool. A team running a serious experimentation program, a data team doing warehouse-level behavioral modeling, or anyone who needs predictive segmentation at the edge of what the category can do should pick Amplitude, Mixpanel, or PostHog on the merits above and not look for a substitute. A broad platform that joins many data sources is not a like-for-like swap for a category-leading analytics engine, and we say so in our honest alternatives roundups. For deep, single-purpose behavioral analysis, dedicated wins. That is real, and no amount of consolidation talk changes it.
The question all three leave open
Every page-one result compares these tools on how well each answers what users did. None of them touch the limit they share: the answer lives in its own silo. Amplitude, Mixpanel, and PostHog can all tell you a funnel dropped 30% at step three. None of them tell you which accounts dropped, or how much revenue those accounts represent, without you exporting the cohort to a spreadsheet and joining it to billing and CRM data by hand.
That gap is not a feature any of the three is missing - it is a consequence of product analytics being one silo among many. The average company already runs 101 SaaS apps and wastes roughly $21M a year on licenses nobody uses (Okta and Zylo). Adding a best-in-class analytics silo answers the behavior question and leaves the who-and-how-much question to a manual join.
That is the problem we chose to solve, and it is a different problem than "which analytics tool is best." AIOProductOS provides first-party web and product analytics joined to the customer record: revenue-weighted funnels and retention, session replay, and feature flags, so a funnel drop links straight to the account and the revenue behind it. It consolidates Amplitude, Mixpanel, and Heap among other sources. Honestly: it is not a like-for-like swap for any single one of them, and if pure analytical depth is your need, the dedicated tools above are the right buy. The value is the join, not out-featuring a category leader.
If you are picking between the three, start with the neutral criteria - and read the full ranked comparison in our best product analytics tools guide.