What is a north star metric?
A north star metric is the single number that best captures the value your customers get from your product, chosen because sustained growth in it should lead to revenue. It sits above team KPIs: every team owns inputs that move it, and the roadmap is judged by whether it went up.
The one-line definition lives in the north star metric glossary entry; this post is about picking one that holds up. The usual checklist says a good North Star reflects customer value, leads to revenue, and measures progress often enough to steer by. That checklist is right. The examples that usually come with it are the problem. The commonly cited ones - nights booked, time spent listening, rides taken, daily active users - all come from consumer products, where one user is roughly one unit of value and one unit of revenue. Most B2B SaaS teams copy the shape of those examples without noticing that the assumption underneath them does not hold for their business.
Why a user-count North Star misleads B2B SaaS
In B2B, the customer is the account. One account is many users, and value is spread unevenly: a small number of accounts often carry a large share of the revenue, and seat counts say little about how much any of them depend on you.
Picture a quarter where several small accounts roll the product out to whole departments while one large account quietly shrinks to a few remaining users and then does not renew. Weekly active users goes up. Revenue goes down. The North Star reports a good quarter, and the team that built for breadth gets credit while the churn signal sat in plain view.
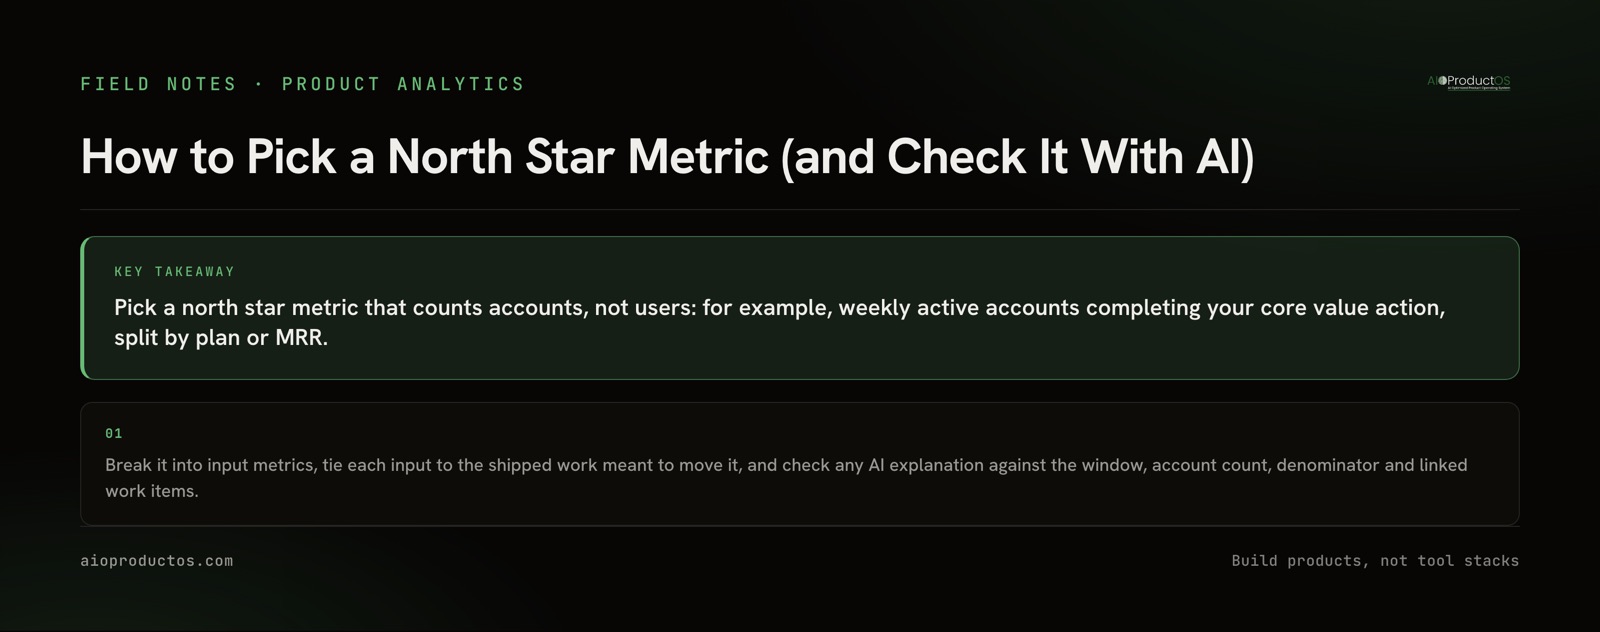
The fix is to change the unit. Count accounts that reached the value, not people who logged in: weekly active accounts that completed the core action. Then split the same number by plan or MRR band, so you can see whether the accounts carrying your revenue are the ones moving. This is the same reasoning behind ranking the roadmap by revenue instead of votes: a count that ignores who pays will reward the wrong work.
| North Star candidate | Unit | What it rewards | Failure mode in B2B |
|---|---|---|---|
| Weekly active users | User | Breadth of logins | Rises while large accounts shrink; seat-heavy accounts dominate |
| Total actions or events | Event | Raw activity | Rewards busywork, automation noise and chatty integrations |
| Signups | User | Top of funnel | Says nothing about value delivered after day one |
| Weekly active accounts doing the core action | Account | Accounts getting value | Blind to size: your smallest account counts the same as your largest |
| The same, split by plan or MRR band | Account plus revenue | Value where the revenue sits | Needs billing joined to usage; small bands get noisy |
| MRR from accounts doing the core action | Revenue | Revenue backed by real use | Lags, and moves with pricing changes as well as product changes |
The fourth and fifth rows are where most B2B teams should land. The last row is a useful companion, not a replacement, because a price change can move it without a single customer getting more value.
How do you choose a north star metric?
Start with the value moment. Write one sentence describing the action after which a customer is better off because your product exists - not "logged in", but "shipped a release", "closed a ticket with the answer", "sent the report their boss reads". That action is your core action. If the team cannot agree on the sentence, the North Star debate is really a strategy debate, and it should be had as one.
Then make four decisions and write them down:
- The unit. Accounts for B2B, with the plan or MRR split attached. Users only if each user is a buyer.
- The cadence. Weekly if the core action happens weekly in healthy accounts; monthly if the natural rhythm is slower. A weekly metric on a monthly habit produces false alarms.
- The denominator. "Active accounts out of what?" Usually paying accounts past onboarding. Changing the denominator later silently rewrites history, which is the same trap covered in how to measure feature adoption.
- The revenue check. Look back at accounts that did and did not do the core action regularly, and compare renewal and expansion. This is correlational - it shows the metric travels with revenue, not that it causes it - but a candidate that fails this check should not be your North Star.
Tie the input tree to the work, or nobody can say what moved it
A North Star on its own is a scoreboard. To steer by it, break it into the inputs that produce it: new accounts reaching the core action in their first weeks (activation), more teams inside each account doing it (breadth), the action happening more often (frequency), and active accounts staying active (retention). Each input gets an owner. These are the product metrics that matter, arranged so each one has a parent.
The step most teams skip is the last link: every roadmap item should name the input it is meant to move. When that link exists, the quarterly review can answer a real question - these shipped items targeted activation; did activation move, and in which MRR band? When it does not exist, the review becomes a story about effort. Outcome-based roadmaps covers writing the outcome onto the work; the verdict procedure for feature impact on retention covers judging each item afterwards.
This is the part a connected record makes cheap. In AIOProductOS analytics, first-party product analytics, revenue-weighted funnels and retention sit on the same customer record as billing and work, and Goals/OKRs live on that record too. Every shipped feature carries a verdict on its task card - adoption, MRR adopted, retention lift - and the lift is labelled correlational unless a declared A/B winner supplies a measured one. Outcomes is where that "did what we shipped work?" answer lives.
When a single North Star is the wrong tool
A North Star is a commitment device, and some companies are not ready to commit or are shaped so that one number hides the truth.
Before product-market fit. You do not know the value moment yet, so any North Star you pick will be a guess you then optimize. Track a few candidate core actions and talk to customers until one of them predicts retention.
Multi-product companies. Products with different buyers and different value moments need their own measures. Forcing one number across them means the biggest product sets the agenda and the smaller ones look broken.
Two-sided marketplaces. Buyers and sellers get different value. A single transaction count can grow while one side quietly has a worse experience, so many marketplaces track each side alongside the shared transaction.
Very small account counts. With a few dozen accounts, one account onboarding or churning moves the number more than any product change. At that scale, read the accounts individually; the metric is mostly noise.
Ask your AI assistant: did the North Star go up, and why?
This is where teams now get burned. Ask an AI assistant "did our North Star go up last quarter, and why?" and, unless it can query the joined record of usage, accounts, revenue and shipped work, it will produce a plausible narrative: a launch happened, the number rose, therefore the launch worked. The prose reads well and nothing in it can be checked.
Ask questions that force a checkable answer instead:
- "How many accounts completed the core action each week over the last 12 weeks, out of how many eligible paying accounts?"
- "Split that by plan and MRR band. Which band drove the change, and how many accounts are in it?"
- "Which shipped work items in that window were linked to the input that moved?"
- "For those items, what were adoption and retention among adopting accounts versus the rest - and is that comparison causal or correlational?"
- "What did net revenue retention do over the same window, and does it agree with the North Star?"
A verifiable answer must contain five things: the query window, the account count, the denominator, the specific work items linked (by name or id, not "recent improvements"), and an explicit statement that per-feature lift from observational data is correlational unless an experiment backed it. An answer missing any of those is a summary, not a measurement, and should be treated as a hypothesis.
Over the AIOProductOS MCP, any MCP client can ask these against the record rather than a summary of it: get_retention for retention, analyze_nrr for net revenue retention, analyze_funnel for revenue-weighted conversion by step, and list_objectives for the goals the inputs roll up to. Revenue, demand and work questions compute deterministically, with no model call in the number itself, and update_key_result can write the reading back onto the key result, with writes landing in human review. To connect it, run npx -y @aioproductoscom/mcp@latest locally or point your client at the hosted endpoint, https://platform.aioproductos.com/api/mcp.
If you want to run these questions against your own accounts, revenue and shipped work, start a 7-day free trial - no card required.