Almost every roadmap prioritization guide hands you the same menu: weighted scoring, MoSCoW, cost of delay, RICE, value-versus-effort. They all treat revenue as one criterion among many - a number you assign on a 1-to-5 scale based on how lucrative something feels. What none of them show is the mechanical step that makes revenue prioritization real: attaching an actual dollar figure to each roadmap item by joining it to the accounts, deals, and churn risk behind the request, then ranking by revenue at stake instead of vote count. That join is the whole method. Here it is, step by step.
How do you prioritize a roadmap by revenue?
To prioritize a roadmap by revenue, attach a dollar figure to each candidate item: sum the existing revenue at churn risk, the expansion it would enable, and the new deals contingent on it. Rank items by that revenue-at-stake, adjusted for effort - not by how many people requested them. Votes tell you who asked; revenue tells you what it is worth. Revenue is one input in a complete product prioritization framework, alongside effort, confidence, strategic fit, and evidence from customer requests.
The reason this is rarely done isn't that teams disagree with it. It's that the data lives in different tools. Feature requests sit in a feedback inbox, revenue in billing, deal stages in a CRM, churn signals in an analytics suite. Ranking by revenue means joining all four on the same customer record, and most stacks make that a copy-paste chore nobody keeps up. So teams fall back to the one number that's already in the roadmap tool: upvotes. The structural fix is one record where the request, the account, and its revenue are already joined. The manual fix is the rest of this post, and it works in a spreadsheet.
The step framework lists skip: attach a dollar figure
Revenue at stake is not a single number. It is the sum of four distinct pots, and naming them separately is what stops you from undercounting the quiet, defensive work that a naive "new-deals-only" view misses.
- Retention at risk. Existing MRR from accounts that have flagged this gap as a reason they might leave, or that show declining usage tied to it.
- Expansion blocked. Upsell or seat growth in current accounts that is waiting on the feature.
- New deals contingent. Open pipeline where a prospect has made this a condition of buying - carry the deal value and the stage, not just "a prospect wants it."
- Net-new demand. A softer, discounted estimate of new business the capability could attract, kept deliberately conservative because it's the least verifiable.
With those four pots defined, the method is mechanical:
- For each candidate item, pull the list of accounts and deals tied to it - every open request, sales note, and churn-risk flag that references it.
- Attach each account's actual revenue, sorted into the four pots above.
- Sum them into a single revenue at stake figure per item.
- Divide by effort, or feed the figure in as the impact term inside a scoring model - RICE and WSJF are only as honest as their inputs, and account revenue is the most defensible impact input you have. Our free RICE prioritization calculator and WSJF calculator make you show where each number came from.
- Rank by the result.
This is the part a tracker can't do for you on its own. Trackers show the what - the task list. Ranking by revenue needs the why: every task carrying the customer, the feedback, and the revenue behind it on one record. That's the join we build around - features rank by request count and revenue at stake, and Insights pools feedback across reviews, requests, surveys, and support so the accounts behind a theme are already attached. But the method is tool-agnostic. A spreadsheet with a revenue column pulled from billing beats the best-designed vote board.
A worked example
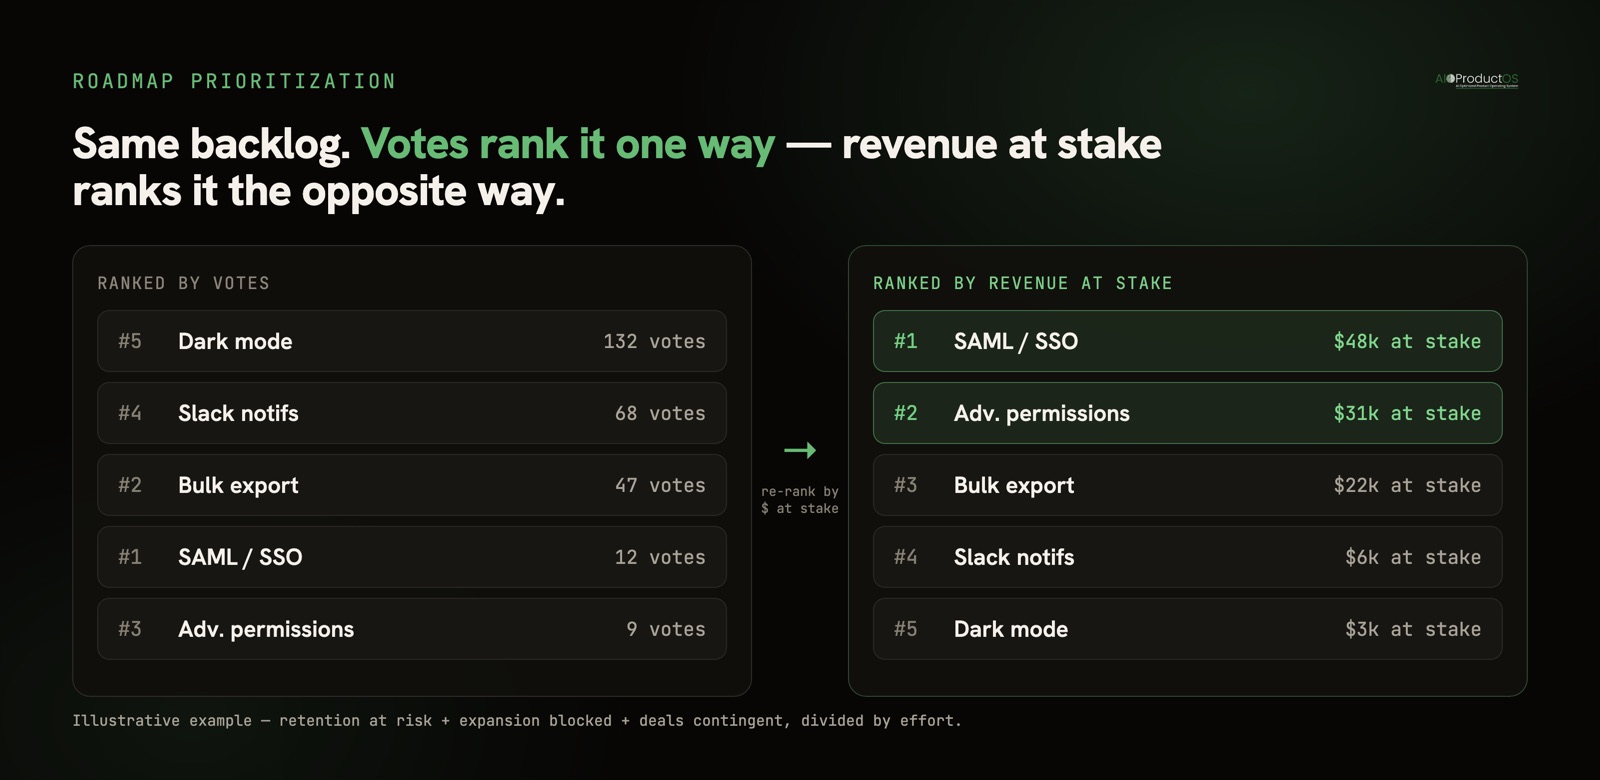
Below is an illustrative example - fictional accounts, invented numbers, to show the mechanism. Five candidate items, ranked two ways.
| Feature | Requests | Revenue at stake (MRR) | Effort (eng-weeks) | Revenue-weighted rank |
|---|---|---|---|---|
| SAML / SSO | 12 | $48,000 (2 enterprise renewals) | 5 | 1 |
| Bulk CSV export | 47 | $22,000 | 4 | 2 |
| Advanced permissions | 9 | $31,000 (1 expansion blocked) | 8 | 3 |
| Slack notifications | 68 | $6,000 | 2 | 4 |
| Dark mode | 132 | $3,000 | 2 | 5 |
Rank by raw votes and the order nearly inverts: dark mode leads with 132 requests, Slack notifications follow, and SSO, the item with the most revenue behind it, sits fourth. Rank by revenue at stake over effort and SSO jumps to first, while dark mode, the crowd favorite, drops to last. Same five items, same team, opposite roadmaps. The vote count wasn't wrong; it was answering a different question. It measured popularity. The revenue column measured consequences.
Notice too what the four-pot breakdown protects. Advanced permissions has only nine requests but ranks third, because a single blocked expansion carries more revenue than 132 people who want a cosmetic change. If you'd scored "impact" from a gut read of the request list, you'd have buried it.
When votes (or a strategic bet) should still win
Ranking by revenue is a discipline, not a religion, and treating it as the only input produces its own failure mode: a roadmap that optimizes for this quarter's invoices and starves everything that pays later. Four cases where you should override the revenue rank on purpose.
- You're too early to have the data. Pre-product-market-fit, with a handful of similarly-priced customers, revenue weighting is noise - every account pays about the same, so the dollar figures just re-rank the vote list with extra steps. Talk to people and use raw demand. The method earns its keep once account revenue varies enough that treating requests equally distorts the picture, usually somewhere past 30-ish accounts.
- Platform and infrastructure work has no revenue line. A migration, a test-coverage push, or paying down architectural debt won't map to a deal, and forcing a number on it invites a fabricated one. Fund this as a fixed slice of capacity, a standing percentage of each cycle, rather than pretending it can out-argue a renewal for a slot.
- A strategic bet contradicts current revenue. The whole point of a bet is that today's customers aren't asking for it yet, so it scores near zero on revenue at stake. New-segment entry, a platform play, a wedge feature - these are founder-and-strategy calls made against the current book of revenue, deliberately, and the ranking exists to show you the cost you're accepting, not to veto the bet.
- Retention work that a new-deals view undercounts. This is the most common quiet mistake. If your revenue lens only counts pipeline, defensive work that prevents churn looks worthless because it books no new money. The four-pot method above is the fix, because it counts retention-at-risk as revenue at stake, but only if you actually populate that pot. Churn you prevent is revenue you keep; it just never shows up as a win unless you measure it.
The honest version of revenue prioritization holds these exceptions as first-class, not as loopholes. A roadmap that can't fund infrastructure or make a bet against its current revenue isn't disciplined - it's short-sighted.
Rank by revenue, then verify the bet
Attaching a dollar figure to each item is the step that turns "prioritize by revenue" from a slogan into a sortable list. Define the four pots, join each request to the accounts behind it, rank by revenue at stake over effort, and keep a deliberate lane for infrastructure and strategic bets that the ranking will always undervalue. Then close the loop: check afterward whether the revenue you predicted actually materialized, so the next round is calibrated on outcomes instead of guesses - a roadmap where every shipped feature carries a verdict compounds, while one that never checks re-runs the same guesswork every quarter. This pairs naturally with the broader method in how to write a product roadmap that works and with the upstream discipline of turning customer feedback into the work it should drive. Where those predictions get written down as objectives and key results, the same connection problem repeats one level up - OKR software for product teams compares which tools keep the scorecard attached to the work and which let it drift into a quarterly copy-paste.
If you're deciding what to run this on, we keep an honest, hands-on comparison of the best roadmap tools, including where each one falls short at connecting requests to revenue. And if you want to see feedback, revenue, and work already sitting on one record, start a 7-day free trial on your own data.