Every RICE guide stops at the first score. The formula is four inputs and one division, learnable in ten minutes, which is why the arithmetic was never the hard part. What decides whether RICE survives is what the sheet looks like in month two.
How do you set up a RICE scoring template?
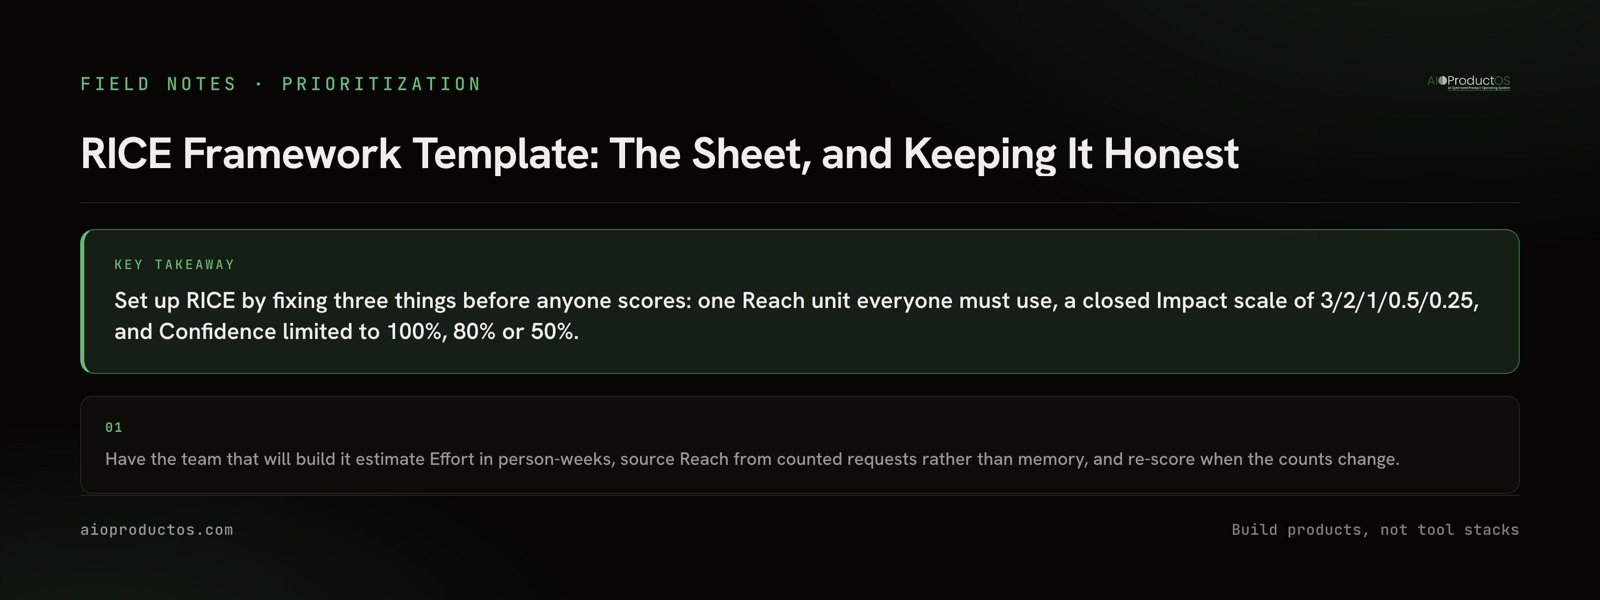
Create five columns - Reach, Impact, Confidence, Effort and score - and fix the units before anyone fills a row. Reach is a count in one stated unit and time window. Impact is 3, 2, 1, 0.5 or 0.25. Confidence is 100%, 80% or 50%. Effort is person-weeks. The score is Reach × Impact × Confidence ÷ Effort.
The template
Copy this table into a sheet and start. The three filled rows exist to make the units unambiguous; replace them.
| Item | Reach (accounts affected per quarter) | Impact (3 / 2 / 1 / 0.5 / 0.25) | Confidence (100% / 80% / 50%) | Effort (person-weeks) | RICE score (R × I × C ÷ E) |
|---|---|---|---|---|---|
| Inline comment editing | 400 | 0.5 | 50% | 2 | 50 |
| Bulk CSV export | 120 | 1 | 80% | 4 | 24 |
| SAML / SSO | 18 | 3 | 100% | 10 | 5.4 |
In a spreadsheet, the score column is one formula: =(B2*C2*D2)/E2, with Confidence stored as a decimal (0.8, not 80%).
Two things are worth noticing in those rows before you use them. First, the enterprise item with the highest Impact and full Confidence ranks last, because RICE deliberately punishes narrow reach - that is the behaviour you are buying, and if you override it you should say so out loud rather than quietly editing the Impact. Second, the top row wins on a large Reach paired with the weakest Impact and Confidence available, which is exactly the shape a score-gaming row takes. RICE surfaces both cases; it does not resolve them.
The fixed scales
Impact and Confidence are closed lists, not sliders. The point of a fixed scale is that a 2 means the same thing in every row and in every quarter. Write these definitions somewhere the team will see them while scoring, not in a document nobody reopens.
| Value | Impact means | Confidence means |
|---|---|---|
| 3 | Massive - changes whether the product is usable for the affected group | - |
| 2 | High | - |
| 1 | Medium | - |
| 0.5 | Low | - |
| 0.25 | Minimal | - |
| 100% | - | You have data: request counts, usage, or a signed commitment |
| 80% | - | You have solid evidence for most inputs and a guess for one |
| 50% | - | Largely judgement; you would not defend the Reach number under questioning |
Reach and Effort carry no scale, only a unit. Pick one Reach unit for the whole sheet - accounts per quarter, active users per month, whichever matches how you already count customers - and one Effort unit. Person-weeks is easier to estimate honestly than person-months, because a week is a length of time people can actually picture.
Why RICE scores stop being comparable in month two
RICE exists to make items comparable to each other. Every common failure is some version of that property quietly breaking while the numbers keep looking fine.
Reach gets estimated in incomparable units. One row says "most users", the next says "400 accounts per quarter", a third is a round number someone felt was about right. The sheet still computes, but the scores are no longer measuring the same thing, which was the entire purpose. The fix is procedural: Reach must be a count with a source - requests logged, accounts on the plan, users who hit the flow - and a row without a source gets 50% Confidence automatically. Teams guess here mostly because the evidence sits in a different tool from the backlog, and the cost of going to get it is real: context-switching is estimated to cost around $450B a year, with the average employee losing about 40% of productive time to it (Gallup / TheTab).
Impact inflates until the scale collapses. Everyone rates their own idea a 3. Within two sessions the median Impact is 2 and the scale has stopped discriminating. Two things hold it: ration the 3, by agreeing that at most one or two items in any batch can be massive, and keep a calibration row - one previously shipped feature everyone agrees was a 1 - pinned at the top of the sheet as the reference.
Confidence becomes a fudge factor. Because Confidence is a multiplier, it is the easiest field to quietly adjust upward to rescue a favourite, and the adjustment leaves no trace. Three values with written evidence tests, as above, make that harder: moving from 50% to 80% now requires naming what evidence appeared.
Effort is estimated by whoever will not do the work. A PM's four weeks and the implementing engineer's four weeks are different numbers, and the difference lands in the denominator where it moves the score most. Whoever will build it owns the Effort field. If they give a range, take the top of it.
Nobody re-scores. Reach and Confidence are statements about the world on the day they were typed. Requests accumulate, deals close, the reason for a 50% either resolves or does not. A scoring sheet detached from the underlying counts is accurate for roughly one quarter and then becomes a record of what you used to believe. Set a re-score trigger - the start of each planning cycle, plus any item whose request count changes materially - and re-score only Reach and Confidence. Impact and Effort rarely move without the item itself changing.
When RICE is the wrong tool for the decision
RICE is a comparison engine, and there are decisions where comparison is not what is missing.
Small reversible bets. If an item takes two days and can be turned off, scoring it costs more than building it. The honest threshold is somewhere around "cheaper to try than to argue about", and below that line the scoring session is overhead dressed as rigour.
Forced work. Compliance requirements, contractual commitments, security fixes and platform deprecations are going to be done regardless of where they land. Scoring them produces a number that changes nothing, and worse, a low score creates an argument that has to be overruled in public every planning cycle. Put them in a separate committed lane and score what is left.
A two-item list. Below roughly ten candidates, a conversation beats a model. RICE earns its cost when intuition stops scaling and when someone outside the room needs a defensible reason for the order.
Step-change work. A platform migration or a new market scores badly by construction: speculative Reach, low Confidence, enormous Effort. That is RICE working correctly within its assumptions, and it is also why a team that only ships the top of the list builds a tidy local maximum. Founder conviction is allowed to overrule the sheet - the discipline is to write down that you did and why, not to inflate the Impact until the model agrees with you.
If the problem turns out to be that RICE is the wrong shape for your decisions rather than that its inputs are weak, the comparison of RICE, WSJF and Value/Effort covers which one fits which situation.
Setting it up in a product tool
The mechanics are the same wherever the sheet lives: five fields, three of them constrained dropdowns, one computed column. Most PM tools will let you build that in an afternoon, and several ship RICE as a built-in field set - on Productboard it sits inside Spark at $15-19 per maker, with AI operations metered as credits at roughly 250 per maker per month.
What differs between setups is not the formula but where Reach comes from. If Reach is typed in by hand each quarter, the discipline above is the only thing keeping the sheet honest, and discipline decays. If Reach is a count the system already holds, most of these failure modes stop being possible. That is the join our PM module is built around: features rank by request count and revenue at stake, every task carries the customer's plan and the revenue behind it, and Insights links each piece of feedback to the feature and the account it came from - so Reach is read rather than remembered. RICE, WSJF, Value-Effort, MoSCoW and Kano all run on those same grounded inputs, and because pricing is flat by tier with no per-seat charge, putting the whole team on the same scoring sheet does not cost more than keeping them off it. Ranking by the revenue behind those accounts, rather than by reach alone, is the next step past a RICE score.
Before you commit a template to your tool, run one real batch of features through the free RICE prioritization calculator - it runs in the browser with no signup, and it will show you within one sitting whether your Reach numbers are comparable to each other or whether you have five different definitions in one column.